Performance Report
The performance report is a large, detailed report attempting to show all vital statistics for a campaign (or a single step). For each email step in a campaign, it lists these statistics for each event (Sent, Opened, Clicked Link, Bounced, Opted Out, and Ordered):
- MTD (Month to Date) totals
- QTD totals
- YTD totals
- Grand Total (forever)
- Prior 6 months
Also, for the Sent and Ordered events, the revenue or expense is listed for comparison.
In between the counts and revenue dollars is a column containing small trend lines. These trend lines show the past 6 months plus the MTD in a trend with the earliest date at the left. This provides a rough view of growth for each event.
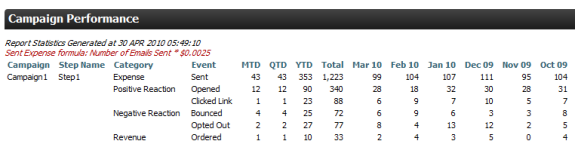
Figure 98 - Campaign Performance - Left Side of Report
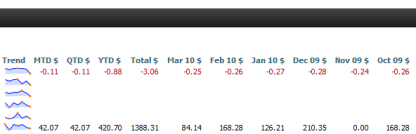
Figure 99 - Campaign Performance - Right Side of Report
Below each step section are eight charts for the step. There are two charts each for MTD, QTD, YTD, and Totals. The two charts are shown below.
The top chart displays a comparison of total counts for each event, excluding the Sent event (it dwarfs the other events, skewing the chart). The bottom chart shows percentages to allow for relative performance comparisons between steps.
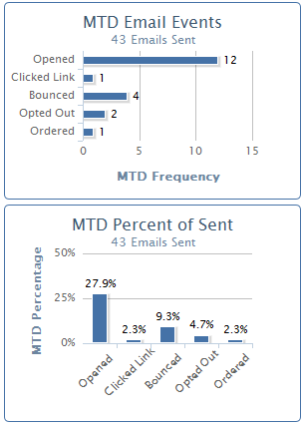
Figure 100 - Performance Report Email Event Comparison Charts