| Table of Contents |
|---|
Navigation
| Panel |
|---|
| Operations → Reporting → ("Reports" section) → Auto Order rebill value |
Overview
The "Auto Order Rebill Value
...
This report will show you the rebill history for each auto orderable item. It may be a little intimidating at first, but let's look at all the columns of data that are produced for an item and dissect a sample scenario.

First notice that it prints the original item ID that the customer purchases as a title for the section. In this example it is SAMPLEITEM." report generates a spread sheet style report with a break down of the rebill value by item.
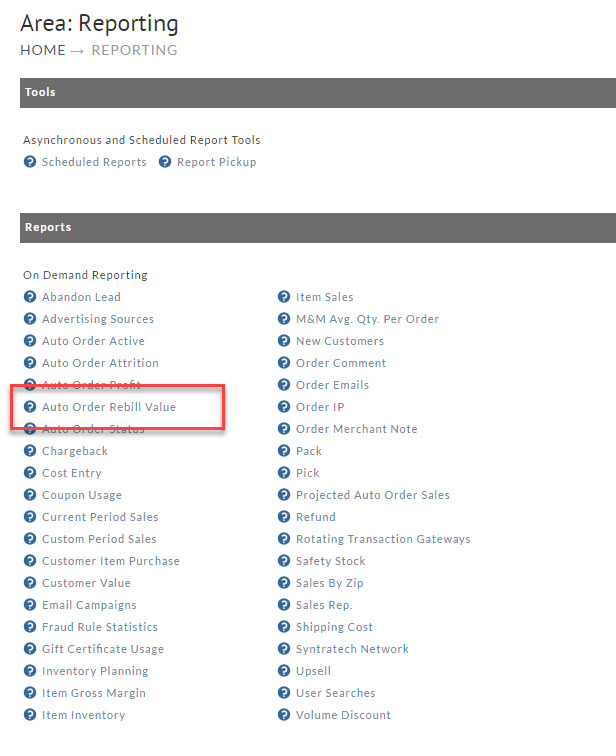
Simply click on the report from the Menu to generate the report.
| Info |
|---|
Because the "Auto Order Rebill Value" Report is for the lifetime of the account, there is no date selection or options for this report. |
Report Pickup
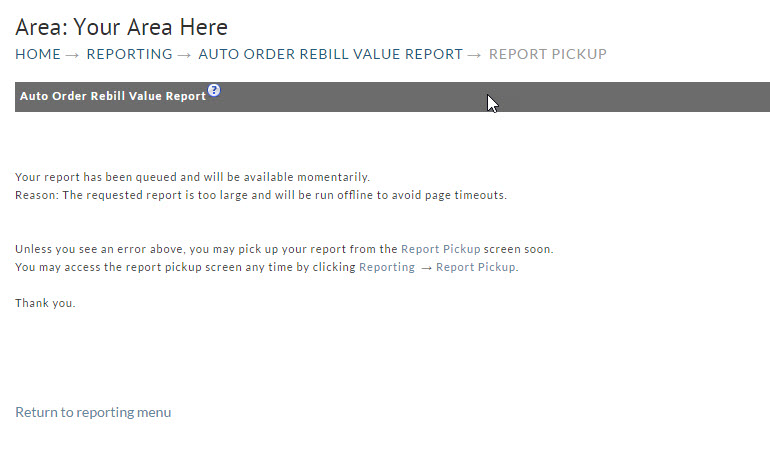
After clicking on the report you will encounter the following message about navigating to the report pickup area to download the completed report:
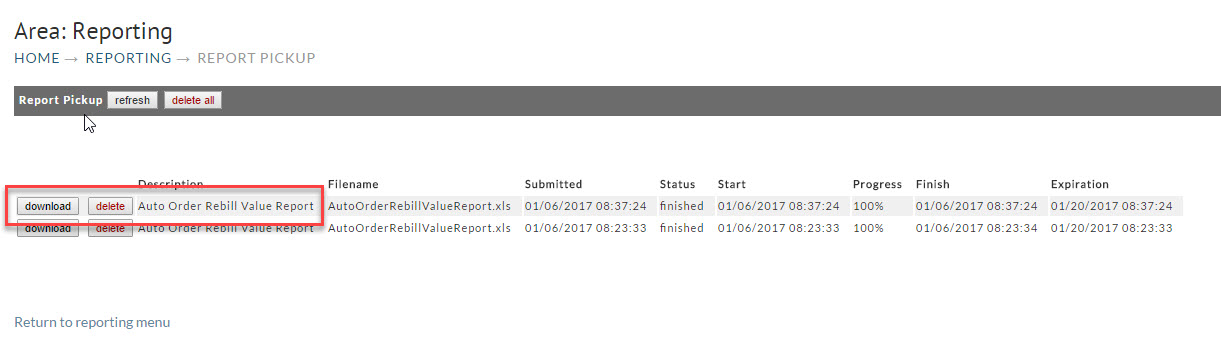
Downloading the Report from Report Pickup
Simply click on the download button to download the file you wish to view.
View of the Downloaded Report
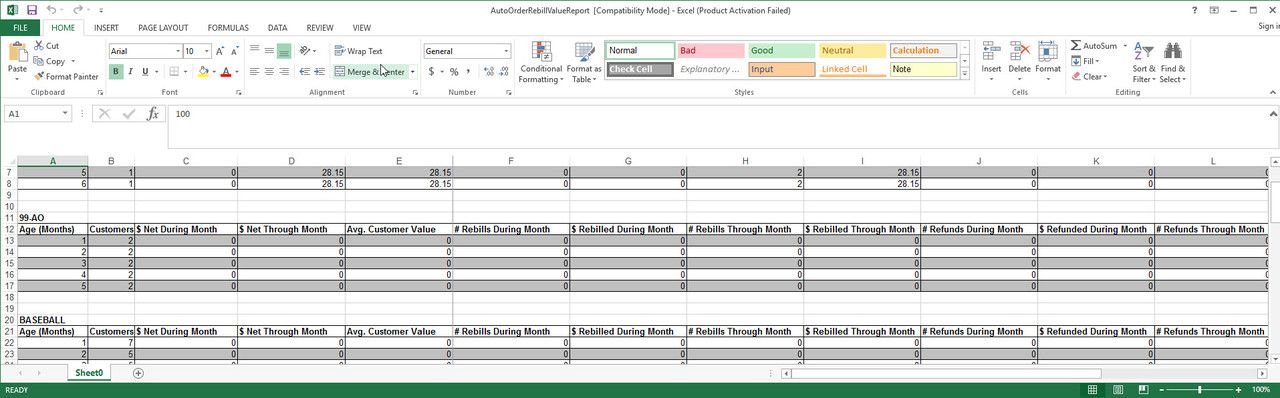
This report provides a breakdown by item of the rebill value per month for the auto orders within the account.
Now let's describe each column in the report
| Column | Description |
|---|---|
| Age (Months) | As rebills occur on an item a row per month will appear in the report starting at 1. The number of rows is determined by the longest active rebill customer. In this example we've been rebilling SAMPLEITEM for nine months. |
| Customers | The number of customers that have made it through this month. In our sample data we started out with 925 customers in month 1. By Month 8 we have only 517 of those customers still actively rebilling. |
| $ Net During Month | The amount of net (sales - refunds) money that rebilled during this month. So we collected $4,297.84 in month 1 and $179.91 in month 8 associated with the rebills of SAMPLEITEM. |
| $ Net Through Month | This is the cumulative net value of this month's rebills plus all the previous months. So by the end of month 8 we have rebilled $12,433.77 |
| Avg. Customer Value | This is the average value of all the customers by the time this month has rolled around. So by month 8 we know that the average customer has been worth $13.44. This number is calculated by the $ Net Through Month column divided by the total number of original customers. So in our example $12,433.77 divided by 925 gives us $13.44 |
| No Rebills During Month | The number of recurring orders that fired off during this month associated with the auto order. So 304 customers rebilled during month 1 and 9 rebilled during month 8. |
| $ Rebilled During Month | This is the gross amount of money rebilled to the customer during the month (not reduced for refunds) |
| No. Rebills Through Month | Total number of rebills that have occurred cumulatively through this month. So by month 8 we have rebilled customers 738 total times. |
| $ Rebilled Through Month | This is the cumulative gross amount rebilled to the customer through the give month. So by the end of month 8 we have rebilled $14,772.61. |
| No Refunds During Month | The number of refunds that have occurred during the month. So the first month was heavy with 90 refunds, but in month 7 we refunded zero people. |
| $ Refunded During Month | The amount of money that was refunded during the month. |
| No. Refunds Through Month | The total number of refunds that have occurred during all the months prior and including this month. So by month 8 we have refunded 117 transactions |
| $ Refunded Through Month | The total amount that has been refunded during all the months prior and including this month. So by month 9 we have refunded $2,338.84 |
| Info |
|---|
How do you make a business decision using this report?This report provides some critical data that you can use to decide on marketing expenditures. Using our example we know that by the end of month 4 our avg. customer value is $10.83. This is a good number to use to decide on how much money you can spend on:
For example if you were selling a digital product that did not have a cost of goods sold, etc. then you could safely say that you could spend $5 per customer in marketing and by the end of month four you would have achieved a gross profit of $5.83 per customer or $5,392.75 total. |