Item Sales Report
This built in report will give the merchant a clear picture of Item Sales Information within a designated date range.
Reporting: Order Location
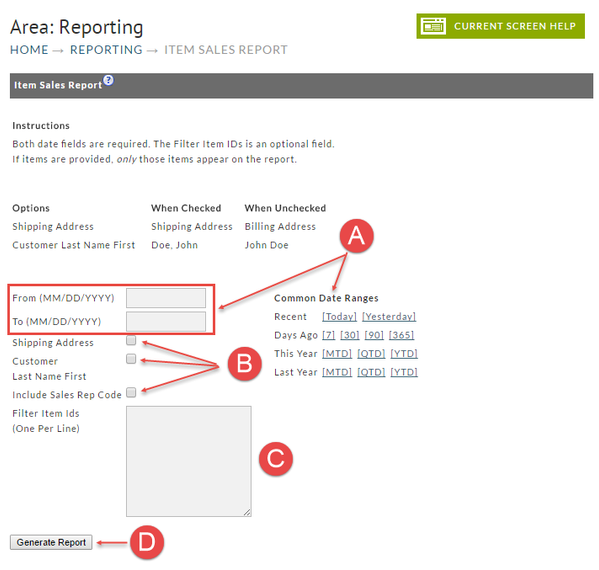
To generate your report you simply;
A. Date Range
- Enter the from/to date range desired or alternatively, click one of the Date Range shortcuts (see below)
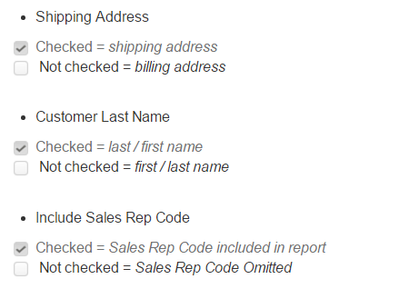
B. Select your optional choices (check box)
C. Filter Item ID's
- Enter Item ID's that you wish to restrict the report to. Enter one per line (enter key starts new line).
D. Generate Report
- Here's the easy part. Click the Generate Report button when finished.
Date Ranges
There are only two dates to be entered;
- From (starting date) and
- To (ending date). This tells the system the reporting period you want to see.
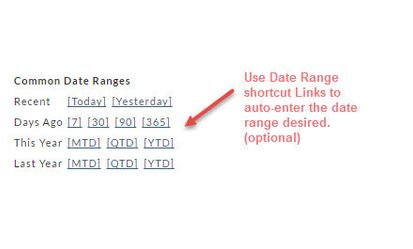
Common Date Ranges (shortcuts)
To the right of the date fields is the Common Date Ranges shortcuts. Consider this optional method for entering your date range to save some typing. Simply click the link from one of the following rows:
- Recent
- Days ago
- This Year
- Last year row.
Generate Report
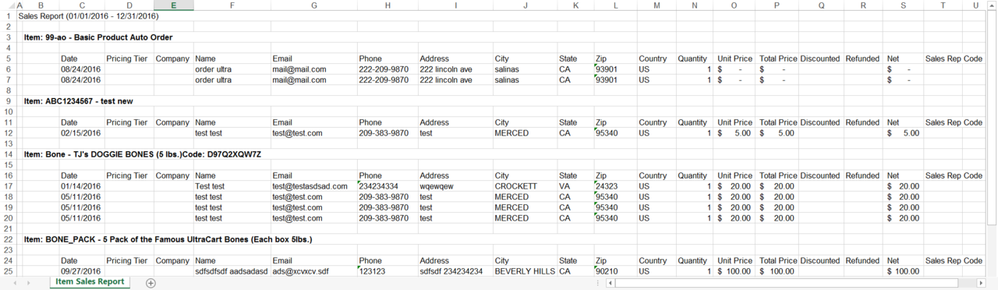
Click the Generate Report button once you have finished entering the Date Range and any optional settings. If the report date range is short, your report may become available immediately. If not, you will receive a Report Pickup notice email informing you what to do when it's ready for pickup (see below). The following is an example of the Coupon Usage Report with very short date range settings. This particular report is comprised of a worksheet with only one tab as shown below:
Report Pickup
If a report that you've created covers a large date range you can expect some wait time. You'll be notified if there is a delay and will be told that you can obtain the report in the Report Pickup area.
Here's an example of the Report Pickup Area
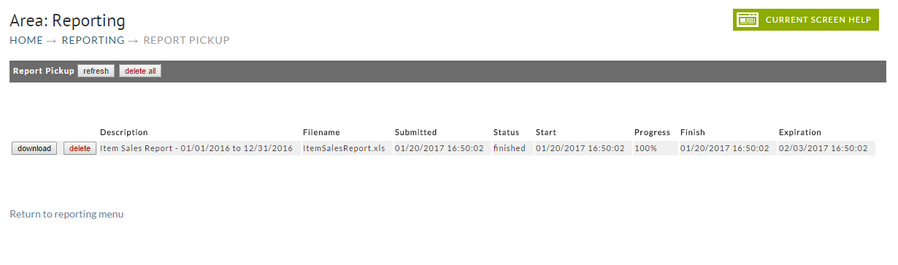
Click here for more about the Report Pickup.
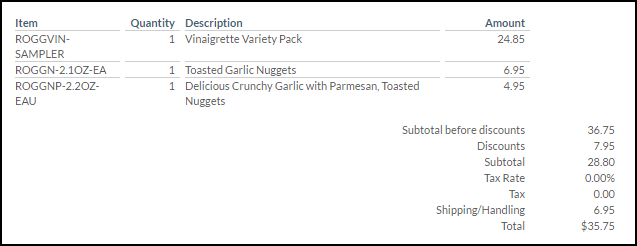
Understanding Subtotal Discount Coupon Impact
This report will spread subtotal discount coupons proportionally to the unit prices shown in the report. This will help you understand the net price that you're selling the product for. Here is an example of the math:
| Item ID | Amount |
|---|---|
| ROGGVIN-SAMPLER | 24.85 |
| ROGGN-2.1OZ-EA | 6.95 |
| ROGGNP-2.2OZ-EAU | 4.95 |
| Item ID | Math | Percentage |
|---|---|---|
| ROGGVIN-SAMPLER | 24.85 / 36.75 | 67.62% |
| ROGGN-2.1OZ-EA | 6.95 / 36.75 | 18.91% |
| ROGGNP-2.2OZ-EAU | 4.95 / 36.75 | 13.47% |
| Item ID | Math | Portion of Subtotal Discount |
|---|---|---|
| ROGGVIN-SAMPLER | 7.95 * 67.62% | 5.37 |
| ROGGN-2.1OZ-EA | 7.95 * 18.91% | 1.50 |
| ROGGNP-2.2OZ-EAU | 7.95 * 13.47% | 1.07 |
Subtracting the portion of the subtotal discount from the original item unit prices we get
| Item ID | Math | Effective Unit Price |
|---|---|---|
| ROGGVIN-SAMPLER | 24.85 - 5.37 | 19.48 |
| ROGGN-2.1OZ-EA | 6.95 - 1.50 | 5.45 |
| ROGGNP-2.2OZ-EAU | 4.95 - 1.07 | 3.88 |